
Overview
The Advanced Fraud Dashboard is a new VeriScan dashboard view built specifically for fraud prevention, separate from the standard dashboard's age-verification focus. It replaces the traditional dashboard with a fraud-specific layout: filterable stats, scan result and volume trends, and choropleth maps that make it easy to see where and how fraud is showing up in your scan activity.
This feature is currently in beta. It is enabled for a limited subset of customers. If you'd like to participate in the beta, contact support to request access.
Who it's for
Customers with an ID Authentication plan who have a fraud prevention use case.
Everyone on the account can see the dashboard, but each user only sees data for the Locations they have permission to view.
Filtering
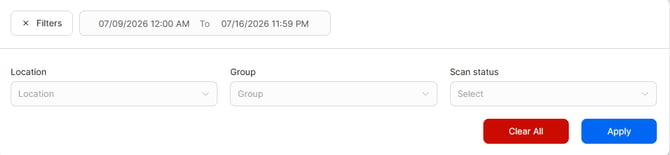
Unlike the standard dashboard (which has no filtering at all), the Advanced Fraud Dashboard adds a Filters panel with three fields: Location, Group, and Scan status.
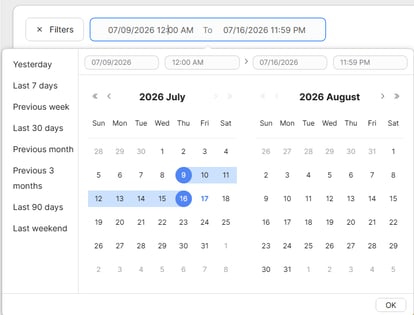
The date range selector at the top of the dashboard supports common presets (Yesterday, Last 7 Days, Previous Week, Last 30 Days, Previous Month, Previous 3 Months, Last 90 Days, Last Weekend) as well as a fully custom date range.
A note on scan status
Passed, Failed, Flagged, and Skipped — used throughout this dashboard's charts and tables — reflect Scan Status, not just Authentication Status. This means Failed includes IDs that failed for reasons like being expired or voided after previously being valid, not only IDs flagged as suspicious or fraudulent.
Quick Stats
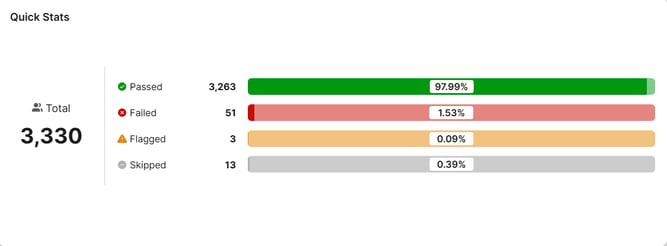
A summary panel shows the total scan count for the selected date range and filters, broken out into Passed, Failed, Flagged, and Skipped, each with a count and percentage.
Scan Result Trend
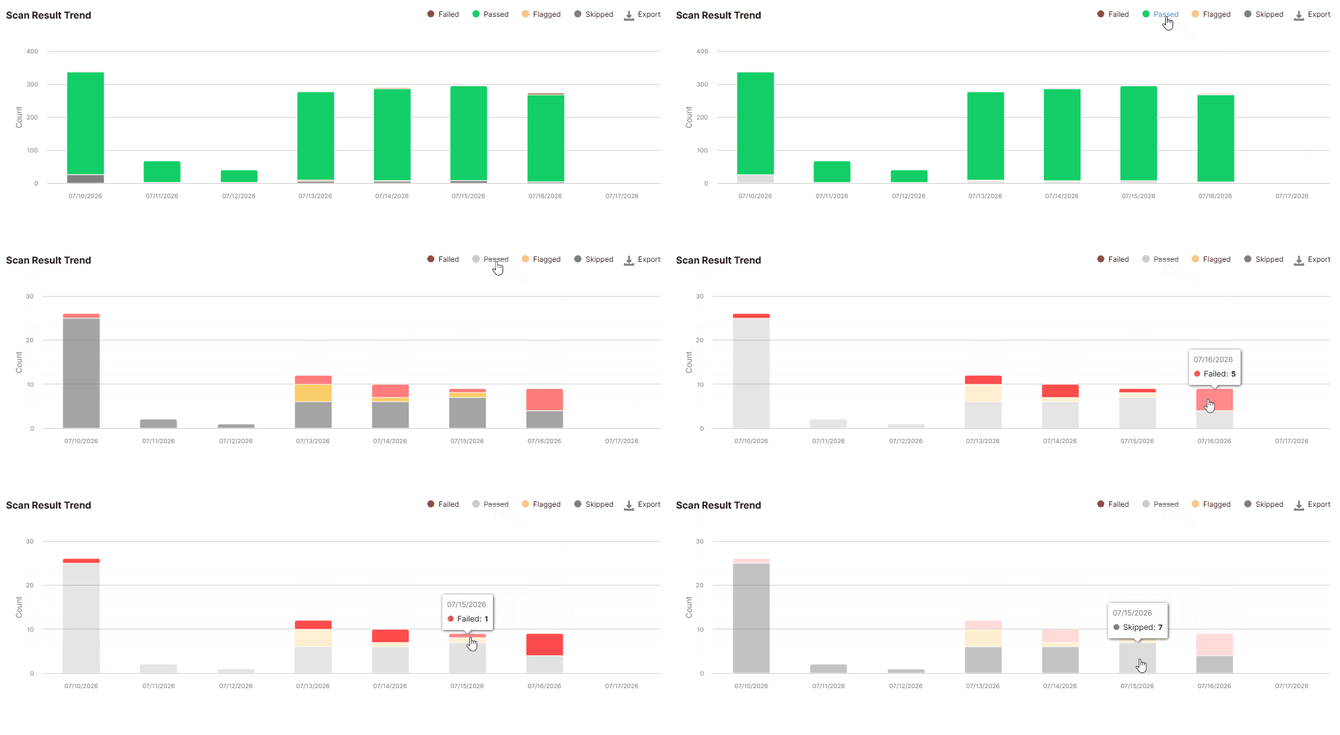
A stacked bar chart shows Passed/Failed/Flagged/Skipped scan counts per day. Click any legend item (e.g., Passed) to temporarily hide that category from the chart — useful since Passed scans are usually so much higher in volume that they can hide the Failed/Flagged/Skipped trend lines.
Scan Volume Trend
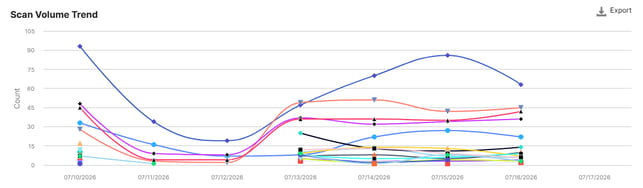
A line chart shows scan volume over time, broken out by location and device (each line represents a specific device at a specific location). Hover over any point to see a popover with the exact date, the location/device name, and the scan count for that day.
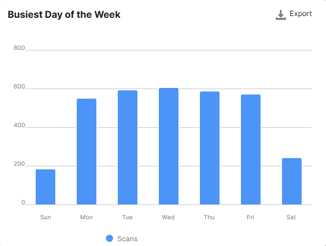
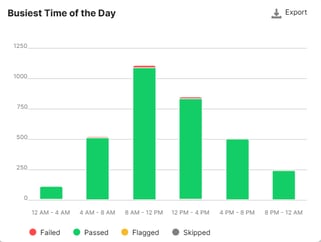
Busiest Day of the Week / Busiest Time of Day
Bar charts showing scan volume patterns by day of week and by time of day.
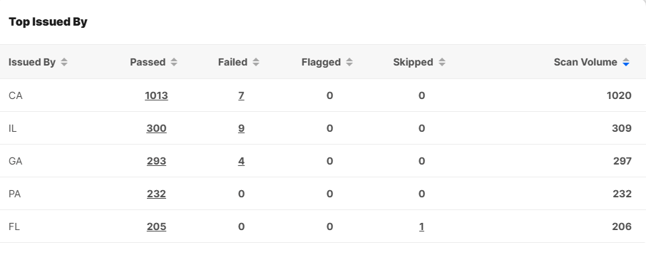
Top Issued By / Top ID Countries
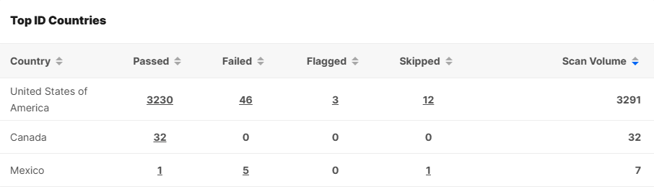
Tables showing scan counts (Passed/Failed/Flagged/Skipped) broken out by issuing state/province and by issuing country.
Maps
Four map-based charts round out the dashboard:
- Device Scan Activity — a US map showing device status by location (Active, No Scans 1–6 Days, No Scans 1 Week+).
- Scan Failures by Scan Location — a US map of scan failures by the location where the scan occurred. This chart requires each Location to have a physical address set in veriscancloud.com/Locations. If it appears blank, add addresses to your locations.
- Scan Failures by Issuing State — a US choropleth map of scan failures by the state that issued the scanned ID.
- Scan Failures by Issuing Country — a world choropleth map of scan failures by issuing country.
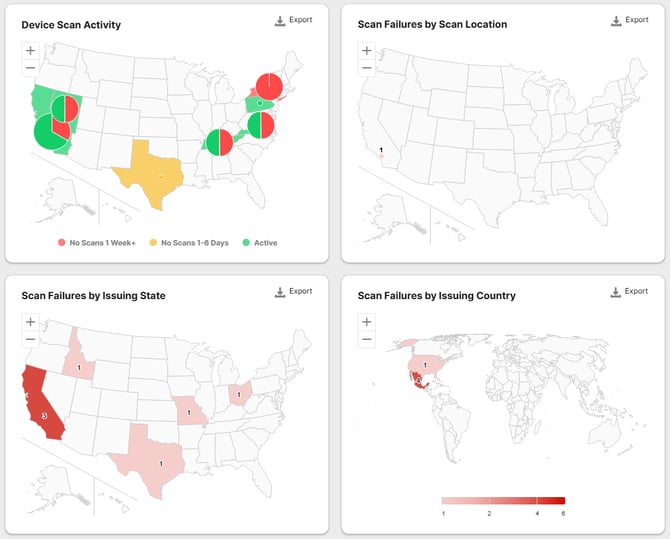
Note: During beta, customers are set up with one regional "issuing" map by default (the US state-level map). Canada or Australia can be enabled instead of the U.S. map, but not simultaneously alongside it. If you'd like your regional map changed, contact support.
Coming soon: additional choropleth maps for province-level scan failures in Canada, state-level scan failures in Mexico, and territory-level scan failures in Australia.
Exporting and drill-down
- Every chart has its own Export button.
- Clicking into a Quick Stats segment or a bar in the Scan Result Trend chart opens a new tab to the History table, pre-filtered to just those scans (for example, clicking "Failed" opens History filtered to Scan status: Failed).
- In that filtered History view, use Configure Columns to bring in whatever fields you need, then export the results to CSV.
Duplicate scan handling and data freshness
Dashboard data is indexed each night. As part of that process, duplicate scans of the same ID from the same location within the same 24-hour period are removed, so if an ID fails and is re-scanned multiple times, it's only represented once in the charts.
This means two things to keep in mind: dashboard counts won't exactly match the History table, since History includes every individual scan. And dashboard data is current as of the previous day's 11:59:59 PM — it won't include today's scans yet. We're looking into a shorter refresh interval so the data can be more current in the future.
Configurable widgets
Released in June, this lets individual portal users customize their dashboard further. It's available now for beta participants and applies to both the standard dashboard and the Advanced Fraud Dashboard:
 Select Widgets lets you search for and show/hide individual charts.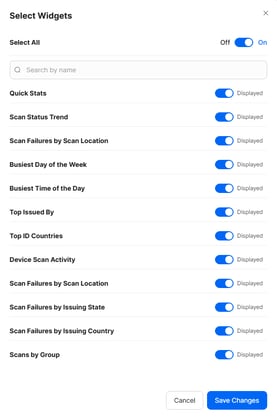
 Arrange Widgets lets you drag and drop charts into the position you want. You can also resize charts horizontally or vertically to make them take up less or more of the screen. Layout choices are saved per user.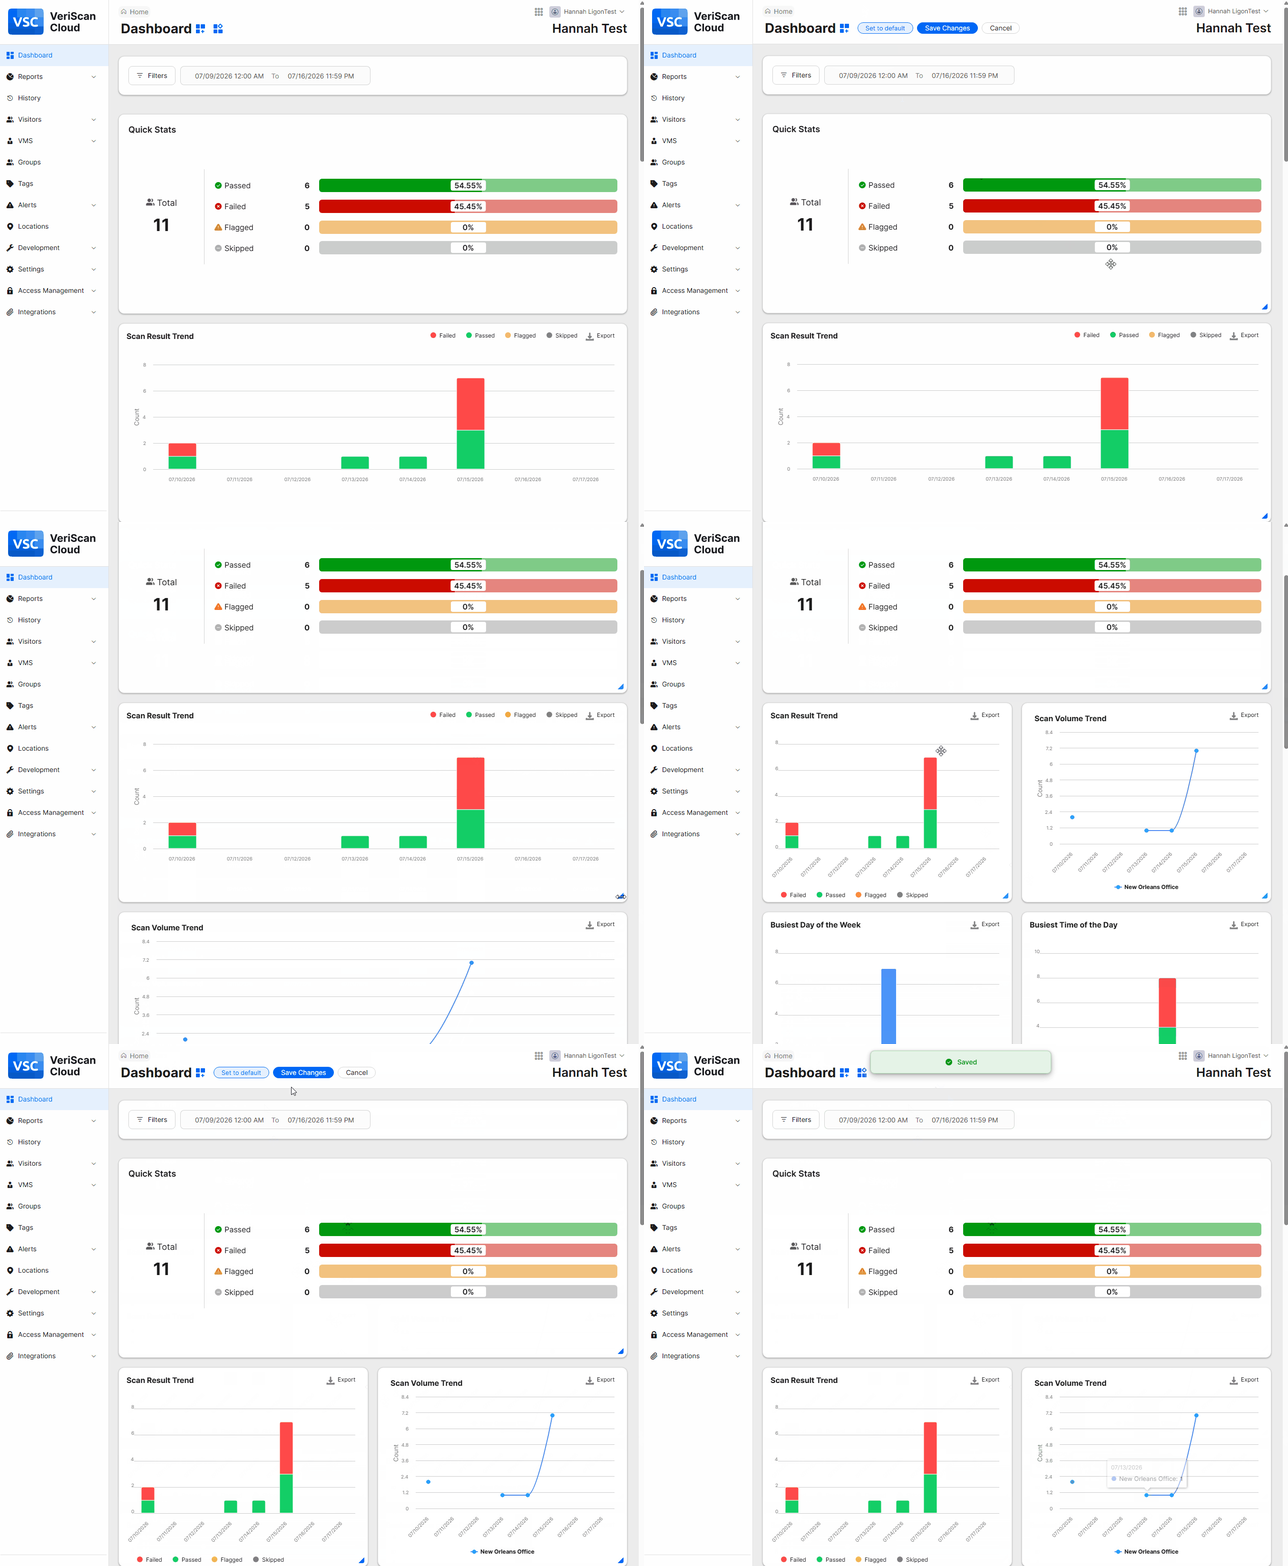
Any changes made in Select Widgets or Arrange Widgets are saved only for that specific user, not account-wide.
Feedback
Because this dashboard is in beta, we welcome feedback on the layout, filters, and maps. Contact support with any questions or suggestions.