Table of Contents
DIVE Portal Statistics
Statistics are essential to many aspects of a business. The statistics on the DIVE portal provide insight into the usage of different capture methods, the performance of configurations, and the success rate of overall submissions.
If a DIVE user has no login, contact an admin for the account. They can create a User account on the my.idscan.net portal.
Two main locations in the DIVE portal contain useful statistics: the Submission Statistics page and the Overview page. To access either page, click on the corresponding tab within the menu on the left side of the screen.
Submission Statistics Page
This page shows statistics of total submissions and the number of pass and fail responses for specific checks given a confidence threshold percentage. This can be very useful for seeing the different results when changing current threshold percentages. The purpose of this page is to be used as a tool to help tune these specific settings in the application.

Filter the data shown on this page by selecting a date range, and further filter the number of submissions that would pass or fail a specific check given a confidence score.
The confidence percentage here is for filtering purposes and will not affect the response received from the DIVE API.
General Statistics - the total number of Successful and Failed submissions within the chosen date range filter.
Face Verification - the total number of submissions where Face Match was enabled. "Verified" indicates this check was enabled.
Face Match - the number of submissions that would return pass or fail for this check if the confidence score was set to the selected value.
Document Confidence - the number of submissions that would return pass or fail for this check if the confidence score was set to the selected value.
Anti-Spoofing - the number of submissions that would return pass or fail for this check if the confidence score was set to the selected value.
Overview Page
This page shows more specific overall statistics. The graphs on this page display the results received based on the configuration settings at the time of each submission - these are the "true" statistics.
A line graph of the account success rate is available to the DIVE user in the portal. This can be filtered independently by the last 60 days, 3 months, or 6 months.

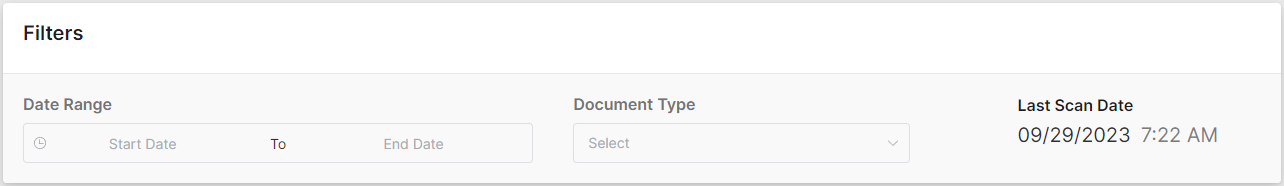
It is possible to filter this page by a specific date range and/or document type. These filters apply to all graphs on the Overview page. The graphs available on this page are explained below:
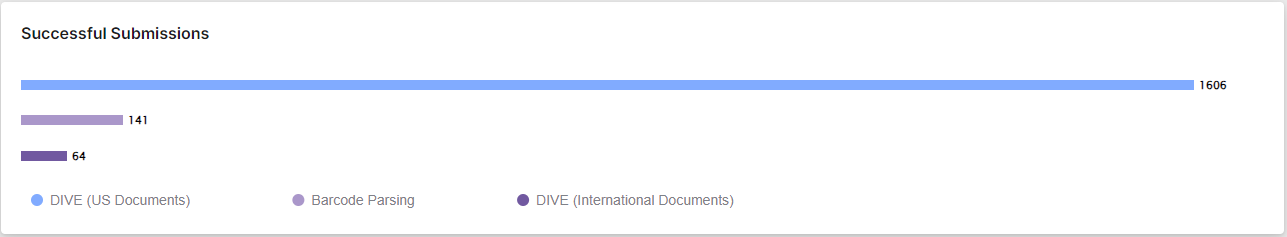
Successful Submissions - This graph shows the total number of successful submissions in three categories: DIVE (US Documents), DIVE (International Documents), and Barcode Parsing only.
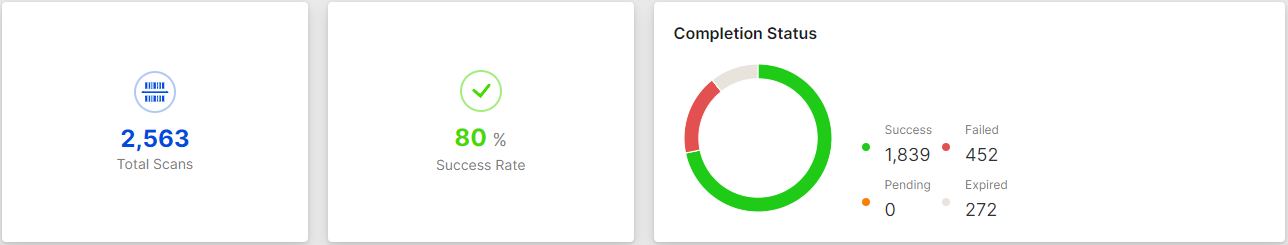
Total Scans - The total number of submissions regardless of whether they were successful.
Success Rate - The percentage of total submissions that were successful.
Completion Status - This graph represents the number of successful, failed, pending, and expired requests.
Completion Status is the status of the request - not the response. Only Successful submissions will receive a response.
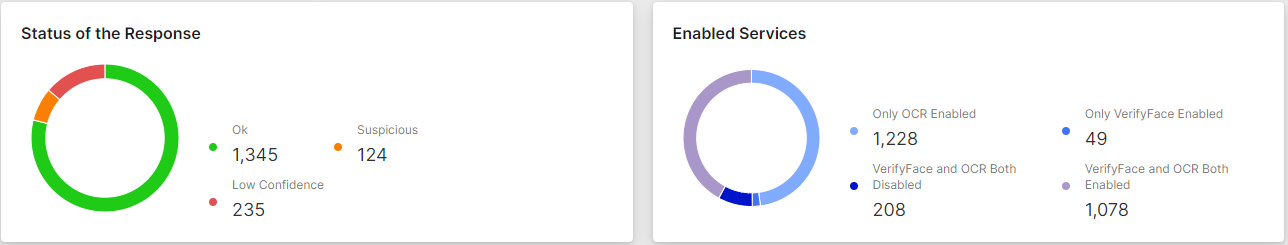
Status of the Response - This graph shows a breakdown of the responses received for successful submissions: OK, Suspicious, and Low Confidence.
Enabled Services - This graph shows how many submissions were done with OCR and/or VerifyFace enabled or disabled.
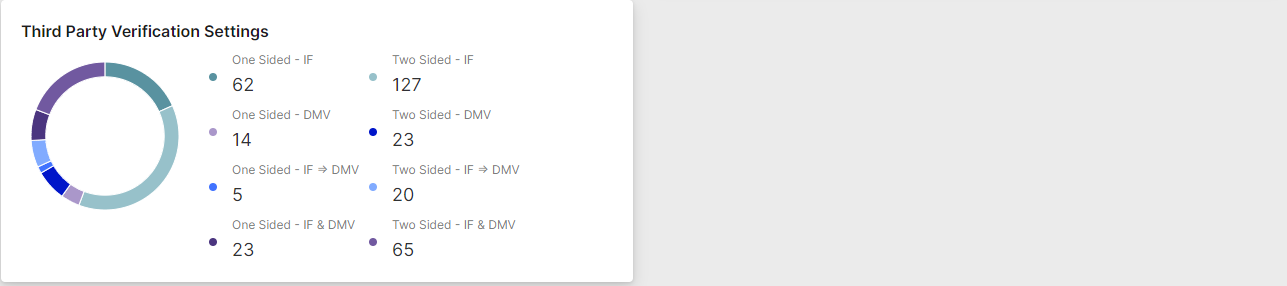
Third-Party Verification Settings - This graph shows the number of submissions where third-party checks were performed. The IdentiFraud and/or DMV check settings can be configured independently for one-sided and two-sided submissions.
Auto-captured Images - this graph shows the success rate and total submissions where the image capture method used was auto-capture (simply placing the ID within the capture window).
Manually Uploaded Images - this graph shows the success rate and total submissions where the image capture method used was manual file upload.
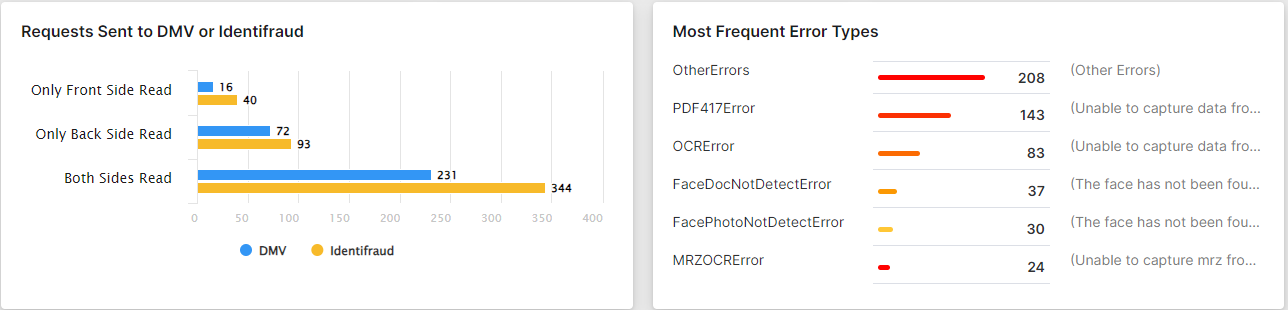
Requests Sent to DMV or IdentiFraud - this chart shows the total number of requests that went out to the DMV or IdentiFraud for a third-party check. It breaks the data down by which side of the ID was submitted and which check was run.
Most Frequent Error Types - This chart shows the most frequent errors received and how many of each type. It also explains what the error means.