Dashboard
The dashboard is all of your account and scanning activity at a glance.
- Account status - lists subscription plan, expiration date, subscribed devices, and access to features like pictures and offline mode.
- Emergency alert - The emergency alert button sends an email with a CSV attachment listing everyone scanned that calendar day (starting at midnight) to any user on the account who has an email address associated with their account with the Emergency Notifications permission enabled. It's intended for mustering purposes in case of an incident on-site.
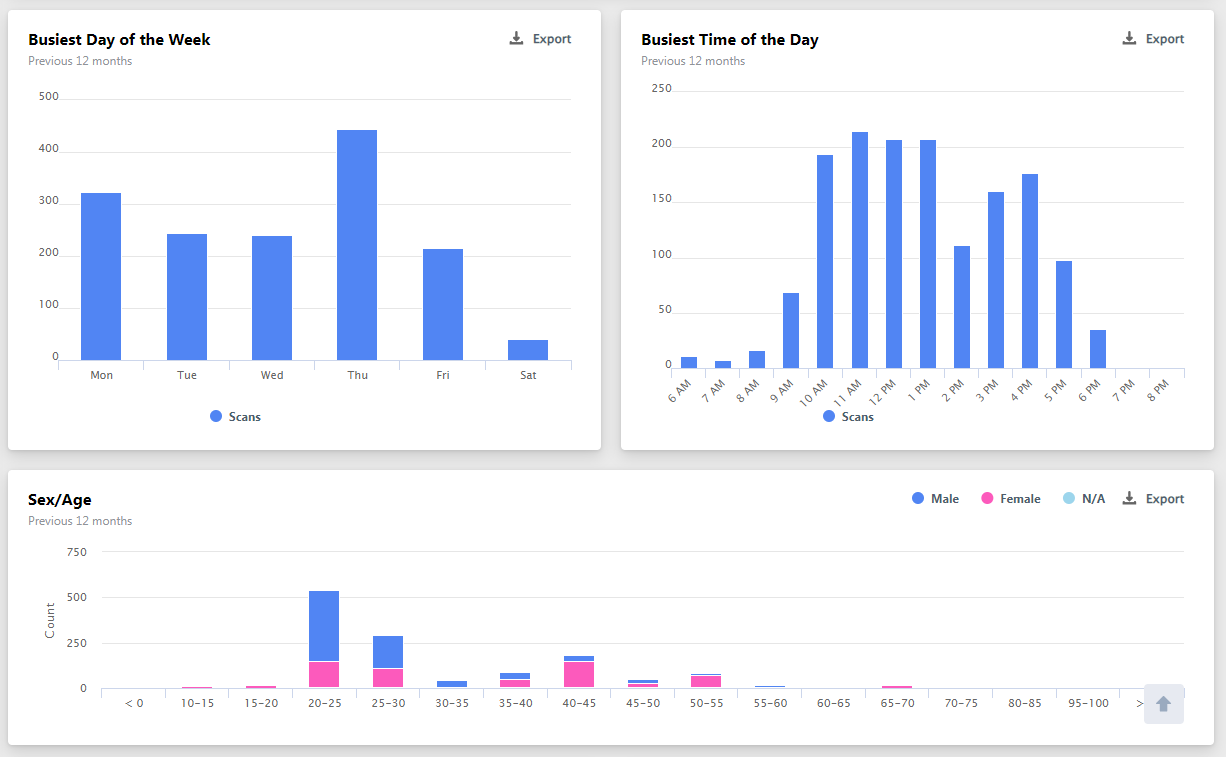
- Additional widgets show Top Cities, Scans (12 months running), Busiest day of the week, Busiest time of day, Sex/Age, Traffic by tag, Traffic by location
Standard reports
- Authentication Failed - select a date range and examine IDs that failed Authentication in that period. Relevant for subscribers at the ID Authentication tier.
- Traffic - this provides an overview of all your scanned data. It displays some metrics such as Total Scans or Top Days within a given time frame. By default, the Traffic Report will display scan metrics for the current month. You can filter the data by month, week, location, and group and export to PDF.
- Monthly Scans by Location - a table listing each location and the number of scans it saw for 12 months running. Export to CSV available.
- Unique Visitors - select a date range to see unique visitors including the number of visits
- ZIP Code - select a date range to see your scan distribution by zip code, with a map view
- Age - select a date range to examine your visitors by age range
Dive deeper and create your own report
History
History shows every scan from devices connected to your account and is the richest source of information if you want to more closely examine your traffic or pinpoint information about a specific visit.
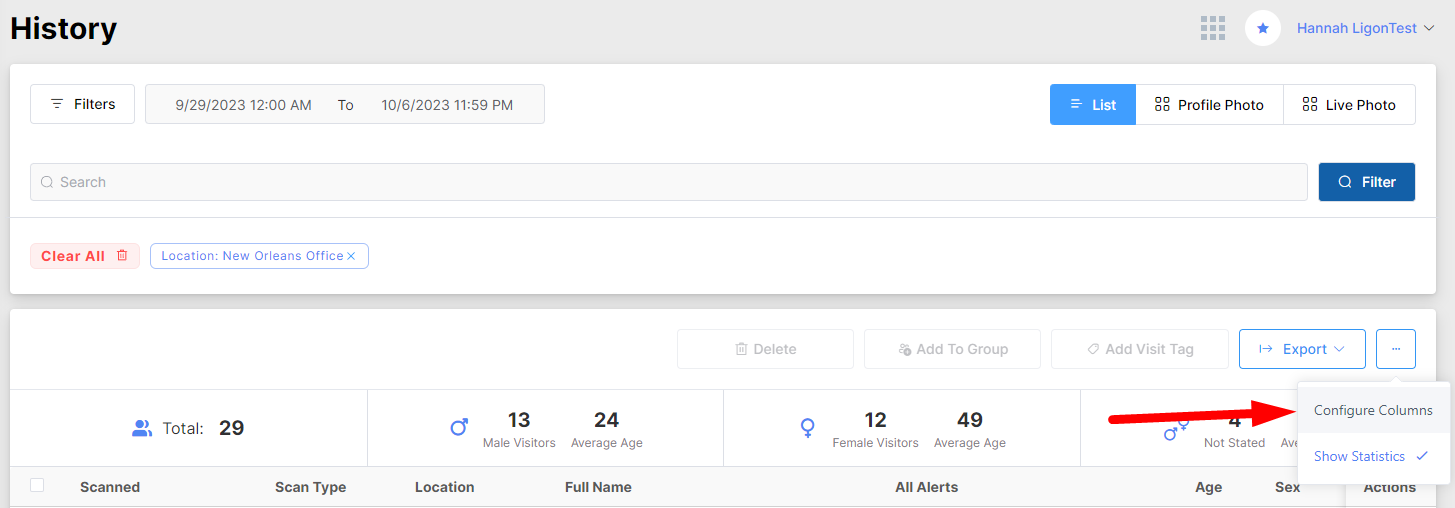
- Select a date range or filter by sex, group, location, age from/to, postal code, tags, document type, authentication result, state, alerts, or device.
- View by table, profile photo, or live photo (if your subscription and scanner allows for photo capture)
- Configure columns in your table to show what's most important to your business and arrange their order by clicking and dragging
- Export table data to CSV to explore in Excel or Google Sheets
- Clicking a visitor's name (or No Data if set to collect anonymized data) opens This Visit, a brief modal describing the visit. Clicking the Details button at the end of the row shows all the details of the visit
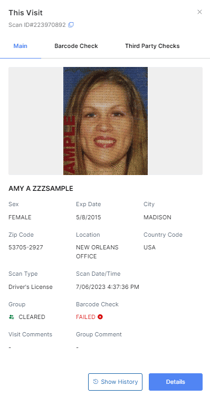
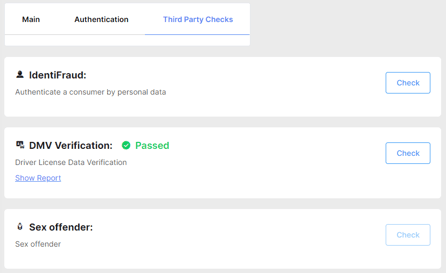
- In either This Visit or Details, there are tabs to view Authentication test results and request Third Party Checks (add-on services that typically have a per-transaction cost).
Visitors
Visitors shows only one entry for a unique visitor and allows you to merge profiles, so that you can have all information about a single person centralized, even though they might have entered your system through scans of multiple forms of ID, like their driver's license and passport.
- Selecting a date range tells you the total visits a user had in that range as well as their lifetime visits
- View by table (with the same ability to configure which columns appear and export to CSV as in History) or view by profile photo
- Merge profiles for the same person by searching for a name, then checking the box next to those profiles and clicking
 . Choose which profile to keep and click Accept to finalize.
 - Clicking a visitor's name shows a brief Profile Preview
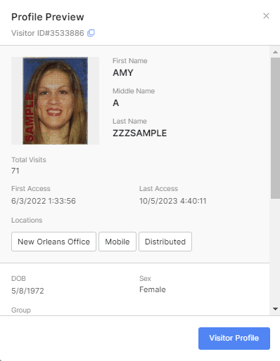
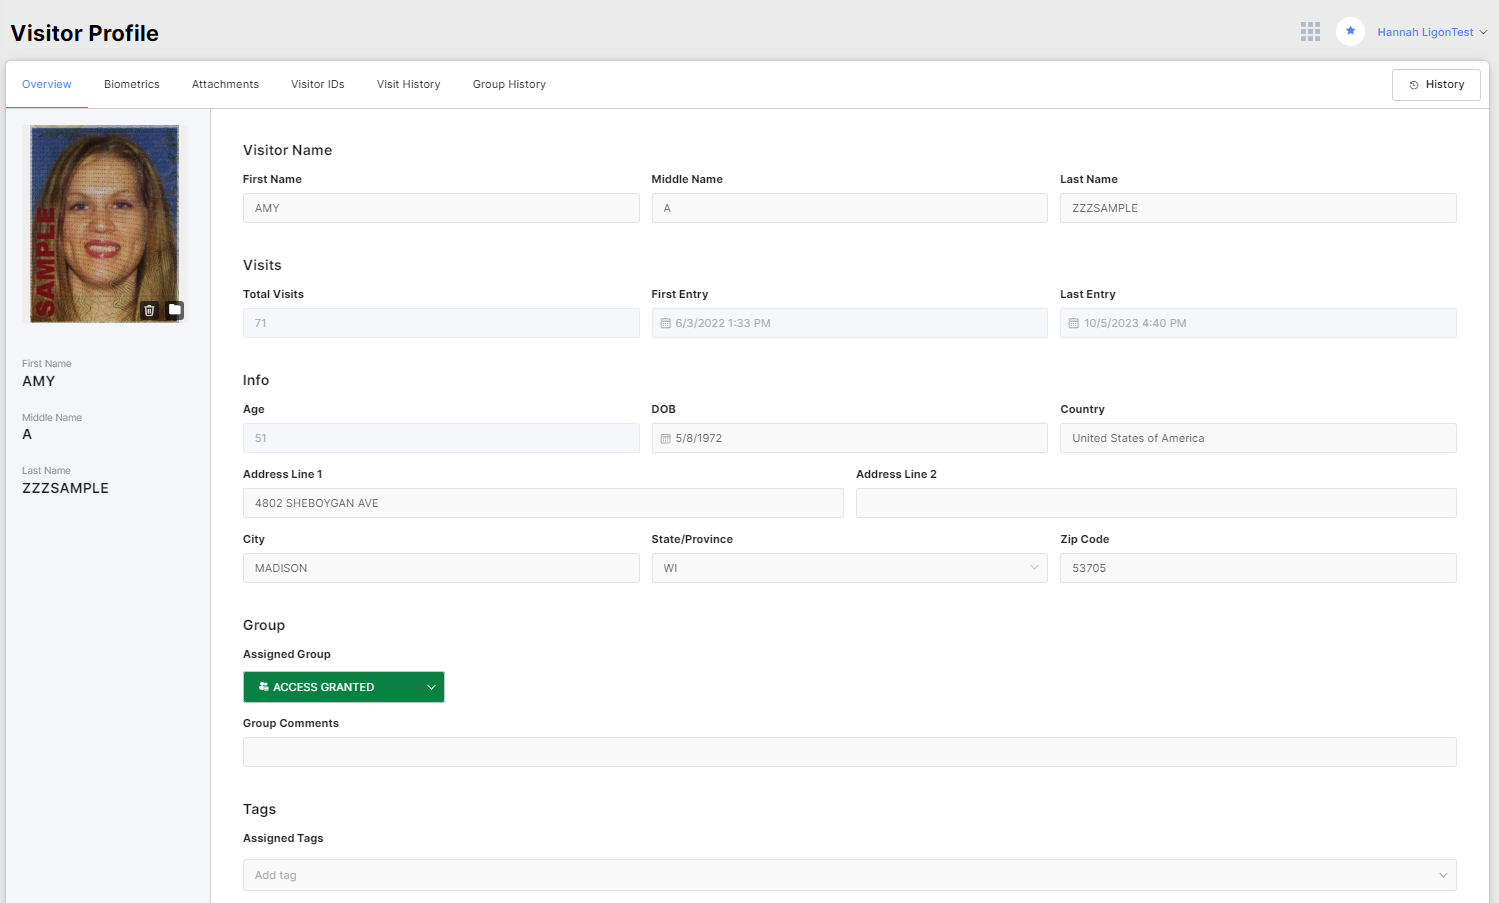
- Clicking Visitor Profile displays more detailed information and allows you to change group, add profile comments, view their Visitors IDs, signed agreements and other attachments, see group assignment history, visit history, and much more.